1.

PRESSURE LOSS AT FLUID FLOW AND ITS CALCULATION

Jiří Škorpík, skorpik.jiri@email.cz
1.3 . . . . . . . . . . . . . .
1.4 . . . . . . . . . . . . . .
1.5 . . . . . . . . . . . . . .
1.7 . . . . . . . . . . . . . .
1.8 . . . . . . . . . . . . . .
1.11 . . . . . . . . . . . . . .
1.13 . . . . . . . . . . . . . .
1.14 . . . . . . . . . . . . . .
1.14 . . . . . . . . . . . . . .
1.17 . . . . . . . . . . . . . .
1.18 . . . . . . . . . . . . . .
1.20 . . . . . . . . . . . . . .
1.22 . . . . . . . . . . . . . .
1.2
Author:
ŠKORPÍK, Jiří, ORCID: 0000-0002-3034-1696
Issue date:           
April 2010, May 2021, June 2023, April 2024 (4th ed.)
Title:
Pressure loss at fluid flow and its calculation
Journal:
Transformační technologie (transformacni-technolgie.cz; fluid-dynamics.education; turbomachinery.education; engineering-sciences.education)
ISSN:
1804-8293

Copyright©Jiří Škorpík, 2024
All rights reserved.

 PRESSURE LOSS AT FLUID FLOW AND ITS CALCULATION
1.3

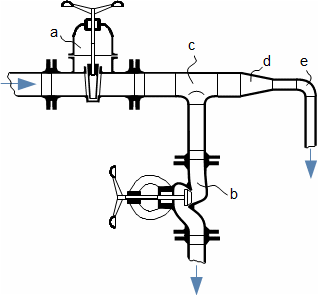
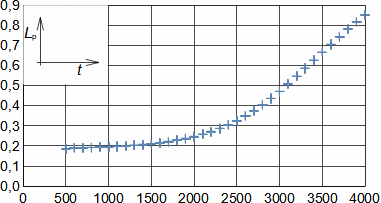
Description of pressure loss development and basic concepts

Internal friction

During the fluid flow, friction on the surface of the flow channel and the flowing bodies as well as friction inside the fluid (so-called internal friction). Through friction, the fluid loses kinetic energy and in order to flow through the channel at the required velocity (flow rate), it must gain kinetic energy at the expense of pressure energy - a pressure loss Lp is created, or at the expense of other energy, such as potential energy, etc.

Pressure loss in pipe

Figure 1 shows the simplest case of pressure loss occurring when an incompressible fluid flows in a constant cross-sectional area pipe. Since the inlet and outlet of the duct must have the same flow, and therefore velocity, with no change in potential energy, the pressure loss Lp is equal to the pressure drop between the inlet and outlet, see Equation 1a.

Fluid friction in pipe and its consequences
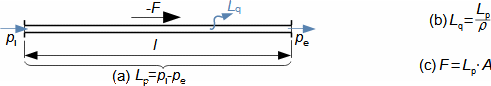
1: Fluid friction in pipe and its consequences
A [m2] flow area; F [N] frictional force acting between channel wall and fluid; l [m] investigated length of channel; Lp [Pa] pressure loss on investigated length of pipe; Lq [J·kg-1] heat loss due to internal fluid friction; p [Pa] pressure; ρ [kg·m-3] density of working fluid. The index i indicates the inlet, the index e the outlet. The derivation of the equations is shown in Appendix 4.

Loss heat

The loss heat Lq, which is generated during friction, heats the working fluid. The loss heat for the case of Figure 1 corresponds to the pressure energy of the pressure loss, see Equation 1(b).

Frictional force

The fluid acts with a frictional force F on the channel in the direction of flow. The friction force for the case of Figure 1 corresponds to the product of the pressure difference between the inlet and outlet of the channel (pressure loss) and the flow area of the channel, see Equation 1(c).

Nozzles

Diffusers

In addition to the pressure loss during the transport of fluids through pipelines, pressure loss also occurs during dynamic processes in channels designed to transform the pressure and kinetic energy of the fluid, such as nozzles, diffusers and blade channels of turbomachines.

 PRESSURE LOSS AT FLUID FLOW AND ITS CALCULATION
1.4

Laminar flow

Turbulent flow

The magnitude of the pressure loss is a function of the properties of the working fluid, the shape of the channel through which it flows and the roughness of the surfaces of the channel. The procedure for calculating the pressure loss in the channel under investigation depends on whether the flow in the channel is laminar or turbulent This can be determined by the value of the Reynolds number for the case in question, for the calculation of which it is necessary to know the mean flow velocity of the fluid, the characteristic lenght of the channel (in the case of pipes this is the diameter) and the value of the kinematic viscosity. If the value of the Reynolds number is less than the value of the critical Reynolds number, then the flow is likely to be laminar, if the value of the Reynolds number is less than the value of the upper critical Reynolds number, then the flow is likely to be turbulent.

For normal technical practice, addressing pressure loss in piping networks with valves is essential.Determining the pressure loss helps to calculate the work of the pump or fan - part of this work is consumed by the pressure loss. Heat loss calculations are crucial in cryogenics for transporting liquefied gases via pipelines, preventing property loss or evaporation.

Darcy-Weisbach equation for calculating pressure loss in pipe

Henry Darcy

Julius Weisbach

Loss coefficient

Pipe fittings

Valves

The relationship for calculating the pressure loss for the case of laminar steady flow as function of dynamic pressure can be derived from the Navier-Stokes equations. This equation is called the Darcy-Weisbach equation, which was developed by the French engineer Henry Darcy (1803-1858) for pipelines, see Equation 2. Later, on the basis of long term experiments and deduction, the German engineer Julius Weisbach (1806-1871) confirmed the validity of this relationship for transient and turbulent flows and even for losses in pipe fittings and valves. The use of this formula is conditioned by the assumption that there is no density change in the pipe section under investigation. Yet, for gas transport in lengthy pipelines, density variations occur. Here, pressure loss calculations rely on mean gas density.

2: Darcy-Weisbach equation for calculating pressure loss
ζ [1] loss coefficient of section related to kinetic energy of mean velocity (defined by Weisbach); V‾ [m·s-1] mean velocity of mass flow (mean flow velocity).
 PRESSURE LOSS AT FLUID FLOW AND ITS CALCULATION
1.5

From the Darcy-Weisbach equation it follows that the pressure loss is a certain fraction of the dynamic pressure, this fraction is given by the value of the loss coefficient. For channels of constant flow area, the loss coefficient can be calculated using the equations given in the chapter Calculation of pipe loss coefficient. For other types of channels, such as elbows, valves, etc., see chapter Pressure loss in local resistances.

Calculation of pipe loss coefficient

Friction coefficient

The loss coefficient for a constant cross-section pipe is computed using Equation 3. It is therefore a function of the length and diameter of the pipe (d is taken to be the characteristic length if the pipe is of non-circular cross-section) and a quantity called the friction coefficient.

3: Equation of pipe loss coefficient
d [m] internal diameter of pipe; l [m] length of pipe; λ [1] friction coefficient in pipe on pipe section under investigation.

Friction coefficient

Johann Nikuradse

Nikuradse chart

Relative pipe roughness

Smooth pipe

Rough pipe

Nikuradse, 1933

Schiller, 1930

Moody, 1944

The equation for the pipe friction coefficient in laminar flow λLF can be easily derived from the Navier-Stokes equations, see Equation 4. The determination of the value of the friction coefficient at turbulent flow is based on the conclusion of measurements made by Johann Nikuradse on a series of glass pipes with artificial roughness using a sand film. Nikuradse measured the pressure loss of several pipes with different relative surface roughnesses for selected Reynolds numbers and from there calculated the values of the friction coefficient λ according to the Darcy-Weisbach equation (Equation 2). From these values he produced a chart of the dependence of the friction coefficient on the Reynolds number and confirmed the existence of four regions with different dependences of the friction coefficient on the Reynolds number, see Figure 4.

Nikuradse chart
4: Nikuradse chart
 PRESSURE LOSS AT FLUID FLOW AND ITS CALCULATION
1.6
left-practical division of Nikuradse chart into basic areas; right-view of original Nikuradse chart [Nikuradse, 1933]. (A) the friction coefficient is linear function of only Reynolds numbers without influence of pipe roughness - laminar flow region; (B) transition region of flow from laminar to turbulent - both laminar and turbulent flow can occur; (C) turbulent flow region, in which friction coefficient is function of both Reynolds numbers and relative roughness of pipe; (D) turbulent region, in which friction coefficient is function of relative roughness of pipe – the higher relative roughness, the greater coeicient of friction. C [1] relative pipe roughness, see also Nomogram 8; Re [1] Reynolds number; ReC [1] critical Reynolds number; λLF [1] friction coefficient for laminar flow, see Appendix 5 for derivation of equation; λSP [1] friction coefficient for turbulent flow in hydraulically smooth pipes (C→0) [Schiller, 1930] ; λRP [1] limit from which friction coefficient does not change with increasing Reynolds number, the so-called flow in hydraulically rough pipe [Moody, 1944]; ε [m] absolute roughness of inner walls of pipe (for values see Table 7).

Friction coefficient

Colebrook equation

Cyril Colebrook

Lewis Moody

Moody chart

Moody, 1944

To calculate the friction coefficient in the regions (C)+(D) in Figure 4 (C-D) regions, semi-empirical relationships approximate Nikuradse chart values, supplemented by other measurements. There is one universal equation with sufficient accuracy for common engineering practice, compiled by Cyril Colebrook (1910-1997), see Equation 5. The American engineer Lewis Moody (1880-1954) then created the widely used Moody chart, derived from the Colebrook equation, e.g. [Moody, 1944].

5: Colebrook equation for calculation of pipe friction coefficient

Marginal Reynolds number

In region (C), turbulent velocity profile develops. In region (D), the evolution is already complete and even with increasing Reynolds number, the ratio of the kinetic energy of the fluid in the boundary layer to the kinetic energy in the flow core does not change. The values of the marginal Reynolds numbers ReRP, i.e. the approximate boundary between regions (C) and (D), can be calculated by substituting the equation for λRP into the Colebrook equation. Selected values of the marginal Reynolds numbers calculated in this way are given in Table 6.

C 1·10-6 1·10-5 1·10-4 0,001 0,01 0,01 0,04 0,05
ReRP 2,62·109 2,22·108 1,82·107 1,42·106 2,28·105 1,02·105 1,95·104 1,48·104
6: Approximate values of marginal Reynolds number
C [1]; ReRP [1] marginal Reynolds number at which the friction coefficient ceases to be sensitive to the change in Re
 PRESSURE LOSS AT FLUID FLOW AND ITS CALCULATION
1.7
     ε      ε
Drawn pipes (new) from: Copper, Brass, glass 0 - 0,0015 Cast iron 0,26 - 1
Plastic ≤0,0015 Galvanized steel 0,15
Steel 0,04 - 0,1 Corroded steel pipes cleaned 0,15 - 0,2
Welded steel pipes 0,05 - 0,1
7: Approximate values of absolute pipe roughness
[mm]. Selection from [Stephan et al., 2010, p. 1058].
8: Nomogram for calculating relative roughness
d [mm], ε [mm], C [1].

Gas Pipeline

The Darcy-Weisbach equation implies that for minimum pressure loss it is advantageous to transport gas at higher pressures and densities than at low pressures and high velocities. Therefore, the pressures in transit pipelines are around 7 MPa and the gas pressure is reduced before the appliances (see Table 9), which are designed for lower pressures for safety reasons.

p p
Transit pipeline 7,5 Medium pressure gas pipeline 0,1...0,3
High pressure gas pipeline 4 Low pressure (household) 0,002
9: Overpressures in natural gas pipelines
p [MPa] overpressure in gas pipeline.

Pressure loss per unit lengt of pipe

For basic pipe route designs, designers use the quantity specific pressure loss in the pipe corresponding to the pressure loss in a 1 m long pipe, see also Nomogram 10.

 PRESSURE LOSS AT FLUID FLOW AND ITS CALCULATION
1.8
10: Nomogram for calculation of specific pressure loss, dynamic pressure and specific kinetic energy of fluid in pipe
pd [Pa] medium dynamic flow pressure; d [mm], Q [m3·s-1], V‾ [m·s-1], ρ [kg·m-3], λ [1], πL [Pa·m-1] specific pressure loss.

Pressure loss in local resistances

Pipe network

The pipe route (pipe network) is not usually straight and may consist of other pipe elements (branch pipes of various shapes, bends, constrictions), fittings, filters, meters and other flow parts, see Figure 11. These elements are local resistances and local pressure loss occurs in them.

 PRESSURE LOSS AT FLUID FLOW AND ITS CALCULATION
1.9
Example of a pipeline route with local resistences
11: Example of a pipeline route with local resistences
a-gate valve; b-closing valve (generally has higher pressure loss than gate valve); c-standard tee; d-narrowing of pipe; e-elbow.

Throttling

Pressure losses in local resistances are usually much more intense than in a straight section of pipe due to the fact that the flow through these sections also changes the shape of the flow channel, the direction of the flow and often the fluid throttling. Inlets and outlets of the pipe can also be considered as a special case of local resistance. At the edges, the flow is usually unsteady and influenced by the shape of the beginning or end of the pipe.

Mean flow velocity

The pressure loss of local resistance can also be calculated according to Equation 2, using the mean flow velocity before the element as the mean flow velocity.

Loss coefficient

Stephan et al., 2010

The loss coefficient ζ of some types of local resistances can be calculated, but more often it is based on measurements of the local resistance for different Reynolds numbers. However, for some types of local resistances the influence of the Reynolds number is not significant and tabulated values can be used, especially for valves and pipe fittings, e.g. in [Stephan et al., 2010, p. 1065]. The corresponding loss factor is provided by the manufacturer of the local resistor in question.

 PRESSURE LOSS AT FLUID FLOW AND ITS CALCULATION
1.10

Loss coefficient

Valve

Stephan et al., 2010

In the case of valves, the manufacturer usually also directly supplies charts of the dependence of their pressure loss on the flow rate (depending on the type of flowing medium). If the nominal flow coefficient of a KVS valve is known, the loss versus flow can be calculated through Equation 12. The nominal flow coefficient is measured on the 2·d pipe section upstream of the valve and the 8·d pipe section downstream of the valve, so the loss coefficient calculated in this way includes this length of pipe - so the actual loss coefficient of the valve is lower by the loss coefficient corresponding to a 10·d smooth pipe. Approximate values of loss coefficients of some valves are given in [Stephan et al., 2010, s. 1073]. However, there are other types of coefficients, usually derived from the pressure loss of the valve. It depends on the manufacturer what methodology he uses to compare valves. The relevant relationships are then given in the valve catalogue.

12: Calculation of valve loss coefficient
d [mm] internal diameter of inlet of valve; KVS [m3·h-1] nominal flow coefficient of valve. The relation is derived for the water flow rate in [Roček, 2002, p. 236].

Closing valve

When selecting the size of the most suitable closing valve, the allowable pressure loss Lp is first determined at the volume flow rate Q and the density of the flowing medium at the inlet ρ. The nominal flow coefficient KVS is calculated. Next, the valve with the next higher KVS is selected from the valve catalogue of the relevant manufacturer.

Equivalent pipe length

Fraas, 1989

For approximate calculation of the local resistance pressure loss, a quantity called the equivalent pipe length can also be used. This quantity gives the length of smooth pipe (expressed as the number of diameters of smooth pipe) of the same diameter as the input diameter of the local resistance under investigation with the same pressure loss. Equivalent pipe lengths of some valves and pipe fittings are given in [Fraas, 1989, p. 447], and a selection is given in Table 13. The advantage is that in the calculation it is sufficient to add the individual equivalent lengths and calculate their total pressure loss as if they were the same length of hydraulically smooth pipe, see Problem 1.

l·d-1 l·d-1
GLOBE VALVES
with no obstruction 340   Y-pattern with stem 60° from run of pipeline 175  
 PRESSURE LOSS AT FLUID FLOW AND ITS CALCULATION
1.11
l·d-1 l·d-1
with guided in flow area (under seat) 450 Y-pattern with stem 45° from run of pipeline 145
ANGLE VALVES
with no obstruction 145 with guided in flow area (under seat) 200
GATE VALVES
convetional wedge 13 conduit pipeline 3
pulp stock 17
CHECK VALVES
conventional swing 35 in-line ball 150
clearway swing 50 foot valves with strainer with poppet lift-type disc 420
globe 340 foot valves with strainer with leather-hinged disc 75
angle 145 butterfly valves 20
COCKS
rectangular plug port area equal to 100% of pipe area 18 three-way 140
FITTINGS
90° standard elbow 30 square corner elbow 57
45° standard elbow 16 180° close pattern return bend 50
90° long radius elbow 20 standard tee with flow through run 20
90° street elbow 50 standard tee with flow through branch 60
45° street elbow 26
FLOW MEASUREMENT
turbine flow meter 150   orifice plates 200  
piston meter 400
13: Equivalent pipe length l·d-1 some valves and pipe fittings
l·d-1 [1] equivalent pipe length. Choice of [Fraas, 1989] supplemented by flow meters [Izard, 1961, p. 299].

Economic velocity in pipe

Acquisition cost

Operating costs

Stephan et al., 2010

The Darcy-Weisbach equation links higher mean flow velocity to increased pressure loss. This, in turn, impacts the cost of acquiring and operating machinery (e.g., pump, fan). Larger pipeline diameters, reducing mean flow velocity, raise costs for pipeline routes and fittings. Usual economic velocities, balancing costs, are derived from this compromise [Stephan et al., 2010, p. 1063], as shown in Table 14. However, factors like layout considerations may influence velocities beyond economic reasons.

 PRESSURE LOSS AT FLUID FLOW AND ITS CALCULATION
1.12
V V
oil 1...2 steam superheated to 4 MPa 20...40
water 1...4 steam superheated at high pressure 30...60, 80
low pressure heating steam 10...15 exhaust steam (after expansion in machine) 15...30
sat. steam up to 1 MPa 15...20 air (compressed) 2...4
14: Economic velocity values in pipes
V‾ [m·s-1]

Pipe diameter

The pipe diameter d is calculated from the design economic velocity, density and required specific flow rate, see Nomogram 15. The calculated pipe diameter must be rounded off according to the manufactured pipe diameters corresponding to the pressure and temperature at which the pipe will be operated.

15: Nomogram for pipe diameter calculation
V‾ [m·s-1], ρ [kg·m-3], m [kg·s-1] mass flow; mm [kg·min-1], mh [kg·h-1], Q [m3·s-1] volume flow; Qm [m3·min-1], Qh [m3·h-1] volumetric flow rate through pipe, d [mm] pipe diameter.
 PRESSURE LOSS AT FLUID FLOW AND ITS CALCULATION
1.13

Characteristics pipeline

The characteristic pipeline is the dependence of the pressure loss of the pipeline route on the volumetric flow rate. From the equation for calculating the pressure loss it is clear that at ρ=const. the pressure loss will be a quadratic function with a parameter CS called the pipeline system constant, see Equation 16.

16: Characteristics pipeline
n [-] number of individual pipeline sections (each section has constant diameter along entire length); k [-] number of local resistances; Lpipe [Pa] pressure loss of pipeline section; Lcomponent [Pa] pressure loss of local resistance; CS [kg·m-7] pipeline system constant; Q [m3·s-1] volumetric flow. Lp,n [Pa] pressure loss at nominal flow Qn through system. The equation is also valid for pipelines of non-circular flow area.

Pipeline system constant

The piping system constant CS is usually considered as a constant for a given opening of individual valves, but since the friction coefficient λ is a function of the Reynolds number, CS must also change with the flow rate. However, this change is not very large if we are interested in the pressure loss in the nominal flow region. The pipeline system constant CS is also changed by opening/closing the valves (change of their pressure losses), therefore several characteristic pipeline curves are sometimes given for individual valve stem positions.

The pipeline system constant can be calculated according to Equation 16 from the individual pressure losses of the pipeline system for a known (nominal) flow rate (see Problem 1) or it can be calculated from the measured pressure loss at a particular volumetric flow rate, see Problem 2.

 PRESSURE LOSS AT FLUID FLOW AND ITS CALCULATION
1.14

Determination of characteristics pipeline from measurements

Logarithmic coordinate system

The characteristic pipeline Lp=f(Q) can be established by measuring different cases. This data can then be processed using computer software. The equation can be determined manually by plotting the measured data in a logarithmic coordinate system and approximating the data with a line whose slope, according to the power of the flow rate the flow rate exponent, see Problem 2.

Change in pressure loss due to pipe fouling or corrosion

Fouling and corosion of pipes and heat exchangers usually gradually causes such problems that they need to be cleaned (increase in pressure in the piping system and the development of leaks, increase in pumping work, etc.).

Pipe fouling

A fouling can form in the pipe if the liquid is not clean. Figure 17 shows the change in pressure loss in a pipeline when there is a uniform fouling in the pipeline - approximately the same percentage increase in pressure loss will increase the pumping work. The relationship in this figure was developed by substituting the Darcy-Weisbach equation into the pressure loss ratio Lp after reducing the flow area and the pressure loss Lp,n. From here it can be seen the reduction in diameter per pressure loss increases with the fifth power. On the other hand, even when absolute roughness is maintained, the effect of the change in friction coefficient is several orders of magnitude smaller.

Change of pressure loss of pipe due to fouling
17: Change of pressure loss of pipe due to fouling
Created for dn=100 mm; Vn=3 m·s-1; εn=0,05 mm; υn=553,2 nm2·s-1 (water at 50 °C); Q=const. F-fouling. The index n indicates the parameters before fouling.
 PRESSURE LOSS AT FLUID FLOW AND ITS CALCULATION
1.15

Crystallization of minerals

Biofouling

Particles fouling

Fouling of the pipeline may be caused by chemical or biological action or by solid particles in the liquid. In the case of a chemical or electrochemical process, minerals precipitate and crystallise on the internal surfaces of the pipe. The biofouling on the pipe can be of plant or animal origin - usually some kind of algae or crustacean - and are highly dependent on water temperature, nutrient content of the water and, in the case of algae, light conditions. A typical sign of fouling by solid particles in the liquid is that it is not evenly distributed along the length of the pipe. The solid particles are deposited in areas of low flow velocity, at the lowest points of the pipeline route where the fluid flow is unable to displace them and upstream of constrictions.

Marginal velocity

Pugh et al., 2009

Scale deposition on the pipe walls does not occur at velocities of approximately 1,5 to 2,5 m·s-1. However, at certain combinations of pH and temperature, this velocity may not be sufficient. Deposition of solid particles can be prevented from velocities as low as around 1,5 m·s-1, but also depends on the orientation of the pipe and the size and mass of the individual particles. Biofouling of pipes can be prevented at velocities above 2 m·s-1. The listed marginal velocities of fouling are for water and the data are from [Pugh et al., 2009]. For other liquids, the limiting velocity may vary because a certain tangential tension, which is a function of viscosity, is required to prevent fouling at lower velocities and vice versa. Constant flow velocity (marginal) during irregular pipeline operation can be maintained by creating loops on the exposed parts of the pipeline in which the fluid will flow at a constant velocity regardless of the flow rate between the inlet and outlet of the pipeline.

 PRESSURE LOSS AT FLUID FLOW AND ITS CALCULATION
1.16

Pipeline shutdown time

The period when the pipes will need to be cleaned, that is, the shutdown time, can be predicted using statistics. This statistical method is based on the assumption that the increase in pressure loss follows a Rayleigh distribution, see Figure 18. To predict the increase in pressure loss due to pipeline fouling, it is sufficient to know an estimate of the operating time after which the pressure loss begins to increase, the expected modus of the rate at which the pressure loss increases most rapidly, and also the rate of increase in pressure loss at the start of fouling, see Problem 3. These estimates can be refined in real operation by measuring the pressure loss and thus refining the prediction of the increase in pressure loss over time.

Rayleigh distribution applied to pressure loss change
18: Rayleigh distribution applied to pressure loss change
n [s-1] change in pressure loss over time; t [s] time. The horizontal axis denotes the difference (V-Vn) because the Rayleigh distribution starts at zero and deposits form only after some time when the flow velocity is nominal Vn. The index n indicates the parameters before fouling.

Pipe corrosion

Pipe corrosion increases the absolute roughness of the pipe and causes a loss of pipe wall thickness. If the material loss does not cause a significant change in the flow surface area of the pipe, then, given the other parameters in the Darcy-Weisbach equation, the ratio of the pressure loss Lp to the pressure loss at nominal (initial) Lp,n can be expressed as a ratio of the coefficients of friction. The data in Table 7 shows that corrosion can increase the pressure loss by tens of percent. Therefore, when calculating the pipe that will not be cleaned of corrosion, the pressure loss must be calculated as if the pipe were corroded.

 PRESSURE LOSS AT FLUID FLOW AND ITS CALCULATION
1.17

Pressure loss at significant density change

General equation

Critical velocity4.

Zucker and Biblarz, 2002

In addition to fluid transport, we encounter dynamic gas flow in which the density of the gas can change significantly. If it is an adiabatic flow of gas through constant flow area, then the pressure loss can be determined by assuming that the stagnation enthalpy of the gas remains constant and equal to the stagnation enthalpy at the inlet, but the entropy will increase due to internal friction. Based on this assumption can be derived so called Fanno equation Equations 19.

19: Equations for calculating the pressure loss when gas flows through channel with constant flow area (Fanno equations)
V*i [m·s-1] critical velocity for case of isentropic flow; κ [1] heat capacity ratio; A [m2] flow area of the channel; V [m·s-1] velocity of gas in investigated point of the channel (this velocity corresponds to velocity during isentropic expansion from stagnation pressure ps to static pressure p); G=const. If channel is not circular, characteristic leght L is used instead of d as in incompressible flow. Derivation in [Zucker and Biblarz, 2002].

Friction coefficient

Dejč, 1967

The friction coefficient λ in Equation 19 is a constant along the length of the channel, but in actual fact is more or less dependent on Re and the Mach number at the channel location under investigation. Experimental verification of the changes in the friction coefficient during compressible flow and the validity of Equation 19 is carried out in [Dejč, 1967, p. 217].

Fanno lines

In adiabatic gas flow, friction heats the gas, increasing its specific volume and velocity in a constant flow area channel. This leads to a gradual decrease in gas pressure and specific enthalpy. The Fanno line on the h-s diagram plots gas states along the channel axis. Figure 20 depicts three Fanno lines for a channel of length l with varying friction coefficients λ, influencing pressure changes as the channel lengthens (the same effect as changes in the friction coefficient has on the pressure change as the channel lengthens). At the maximum λ1, outlet flow doesn't reach critical velocity; λ2 just reaches critical velocity, and λ3, less than λ2, also reaches critical velocity at the outlet.

 PRESSURE LOSS AT FLUID FLOW AND ITS CALCULATION
1.18
20: Fanno lines
h [J·kg-1] enthalpy; s [J·kg-1·K-1] entropy; hs [J·kg-1] stagnation gas enthalpy; h* [J·kg-1] critical enthalpy; psur [Pa] surrounding pressure at outlet of channel. The subscript i denotes the initial gas state, the subscript e the final gas state (at the end of the section/process under study). The subscript s denotes the stagnation gas state.

Seals

Friction coefficient

In engineering practice, the theory is particularly applicable to the investigation of flow in non-contact seals. The principle of dry-running gas seals is also based on the high pressure loss associated with gas flow in a very small gap. However, even labyrinth seals can be likened to a smooth seal with a constant flow area and a particular coefficient of friction.

Problems

Problem 1:

Pressure loss

Pipe network

Pipeline system constant

Pipeline system constant

Find the characteristics pipeline at the discharge of a condensate pump (see attached figure) in which condensate is pumped from the auxiliary condensate tank CT1 to the feed tank through the condensate heater H1. A parallel pipeline system with a redundant pump (blue) is connected to the route. The water temperature at the outlet of the pump is 60 °C and 105 °C after the H1 heater. The flow rate through the pump is 2,4 m3·h-1. The flow coefficient of ball valve 001 is 48,5 m3·h-1. The check valve has a pressure loss of 5 kPa. The minimum pressure loss of the balancing valve is 750 Pa. The pressure loss of the water meter is 18 kPa. The pressure loss of heater H1 is 12 kPa. The piping is standard one-inch water main. The solution to the problem is shown in Appendix 1.
 PRESSURE LOSS AT FLUID FLOW AND ITS CALCULATION
1.19
CT1-auxiliary condensate tank No. 1; H1-heater No. 1; WM1-water meter No. 1. The lengths of the individual sections of the piping system are given in metres.
§1   entry:   ti; te; Qn; KVS,001; Lp,002; Lp,003; Lp,WM1; Lp,H1; l §6   calculation:   ζpipe; Lpipe
§2   read off:   ν; ρ §7   calculation:   Lp,001
§3   read off:   d; ε §8   calculation:   Lp,elbow
§4   calculation:   ; Re §9   calculation:   Lp, n; CS
§5   calculation:   λ    
The procedure for solving Problem 1. Symbol descriptions are in Appendix 1.
Problem 2:

Pipeline system constant

Find the approximate value of the constant of the heating piping system. Hot water flows through the pipe. There are the measured flows through the system and the corresponding pressure loss given in the table below. Measured values adapted from [Pleskot, 1947, p. 17]. The solution to the problem is shown in Appendix 2.
Lp 10 25,1 62 140 320 700 1400
Q 19,64 29,64 50,07 74,61 113,9 161 233,7
Table of measured values
Hodnoty naměřené tlakové ztráty v potrubí zakreslené na logaritmickém papíře
Lp [Pa], Q [m3·s-1].
 PRESSURE LOSS AT FLUID FLOW AND ITS CALCULATION
1.20
§1   entry:   Lp; Q §4   read off:   x; P
§2   marking:   Lp; Q do grafu §5   calculation:   CS
§3   approximation:   hodnot Lp; Q přímkou    
The procedure for solving Problem 2. Symbol descriptions are in Appendix 2.
Problem 3:

Fouling

Calculate the expected increase in pressure loss of the plate water/water exchanger using the statistical method. Scale crystallizes in the exchanger. The nominal flow velocity in the exchanger is 1 m·s-1 and the nominal pressure loss is 0.185 bar. Based on experience with the operation of previous exchangers, the pressure loss starts to increase after 500 minutes with an initial rate of 0.2703·10-3 min-1, and the parameters of the (V-Vn)-n curve in Figure 18 are: nmax=2.1622·10-3 min-1; (V-Vn)mod=1.1911 m·s-1. During operation, the flow rate remains constant. The solution to the problem is shown in Appendix 3.
Increased pressure loss in heat exchanger due to clogging
Lp [bar]; t [min] time.
§1   entry:   Vn; Lp,n; t0; n0; nmax;
(V-Vn)mod
  calculation:   Δt
§2   calculation:   C §4   calculation:   (Lp/Lp,n)k=1; Vk=1; Lp, k=1
§3   proposal:   tmax; kmax §5   calculation:   Vk; nk; (Lp/Lp,n)k; Lp, k
The procedure for solving Problem 3. Symbol descriptions are in Appendix 3.

References

ŠKORPÍK, Jiří, 2022b, Essential equations of turbomachines, Transformační technologie, Brno, ISSN 1804-8293, https://turbomachinery.education/essential-equations-of-turbomachines.html.
DEJČ, Michail, 1967, Technická dynamika plynů, SNTL, Praha.
FRAAS, Arthur, 1989, Heat exchanger design, John Wiley&Sons, Inc., ISBN 0-471-62868-9.
IZARD, Julien, 1961, Příručka technické fyziky, Státní nakladatelství technické literatury, Praha.
MOODY, Lewis, 1944, Transactions of the ASME, Friction factors for pipe flow, 66 (8). http://www.ipt.ntnu.no/~asheim/TPG4135/Moody.pdf
NIKURADSE, Johann, 1933, Strömungsgesetze in rauhen rohren, V. D. I. Forschungsheft, 361: 1–22, Berlin.
PLESKOT, Václav, 1947, Nomografie v technické praxi, Praha, SPASEI.
PUGH, Simon, HEWITT, Geoffrey, MÜLLER-STEINHAGEN, Hans, 2009, Fouling During the Use of “Fresh” Water as Coolant—The Development of a “User Guide”, Heat Transfer Engineering, 30:10-11, 851-858, DOI: 10.1080/01457630902753706.
ROČEK, Jaroslav, 2002, Průmyslové armatury, INFORMATORIUM, Praha, ISBN 80-7333-000-8.
 PRESSURE LOSS AT FLUID FLOW AND ITS CALCULATION
1.21
SCHILLER, Ludwig, 1930, Rohrwiderstand bei hohen Reynoldsschen Zahlen, Vorträge aus dem Gebiete der Aerodynamik und verwandter Gebiete, Springer, Berlin. https://doi.org/10.1007/978-3-662-33791-2_13
STEPHAN, Peter (ed.), VDI Heat Atlas, Springer, Berlin, ISBN 978-3-540-77876-9.
ZUCKER, Robert, BIBLARZ, Oscar, 2002, Fundamentals of gas dynamics, JOHN WILEY &SONS , INC., Hoboken.
©Jiří Škorpík, LICENCE